HOW TO READ AN ECG OUTPUT LIKE A PRO: THE COMPLETE PROFESSIONAL GUIDE
Reading electrocardiograms (ECGs or EKGs) is one of the most essential skills in healthcare, yet it often intimidates students and even experienced professionals. This comprehensive guide will transform you from an ECG novice into a confident interpreter, providing you with the systematic approach used by cardiology professionals worldwide. Whether you’re a medical student, nurse, paramedic, or physician, mastering ECG interpretation is crucial for providing optimal patient care.
Understanding the ECG: Foundation Knowledge
An electrocardiogram represents the electrical activity of the heart as it travels through the cardiac conduction system. Understanding this fundamental concept is essential before diving into interpretation techniques. The ECG captures the heart’s electrical impulses through electrodes placed on the skin, creating a visual representation of cardiac activity that reveals crucial information about heart rhythm, rate, and underlying pathology.
The Cardiac Conduction System

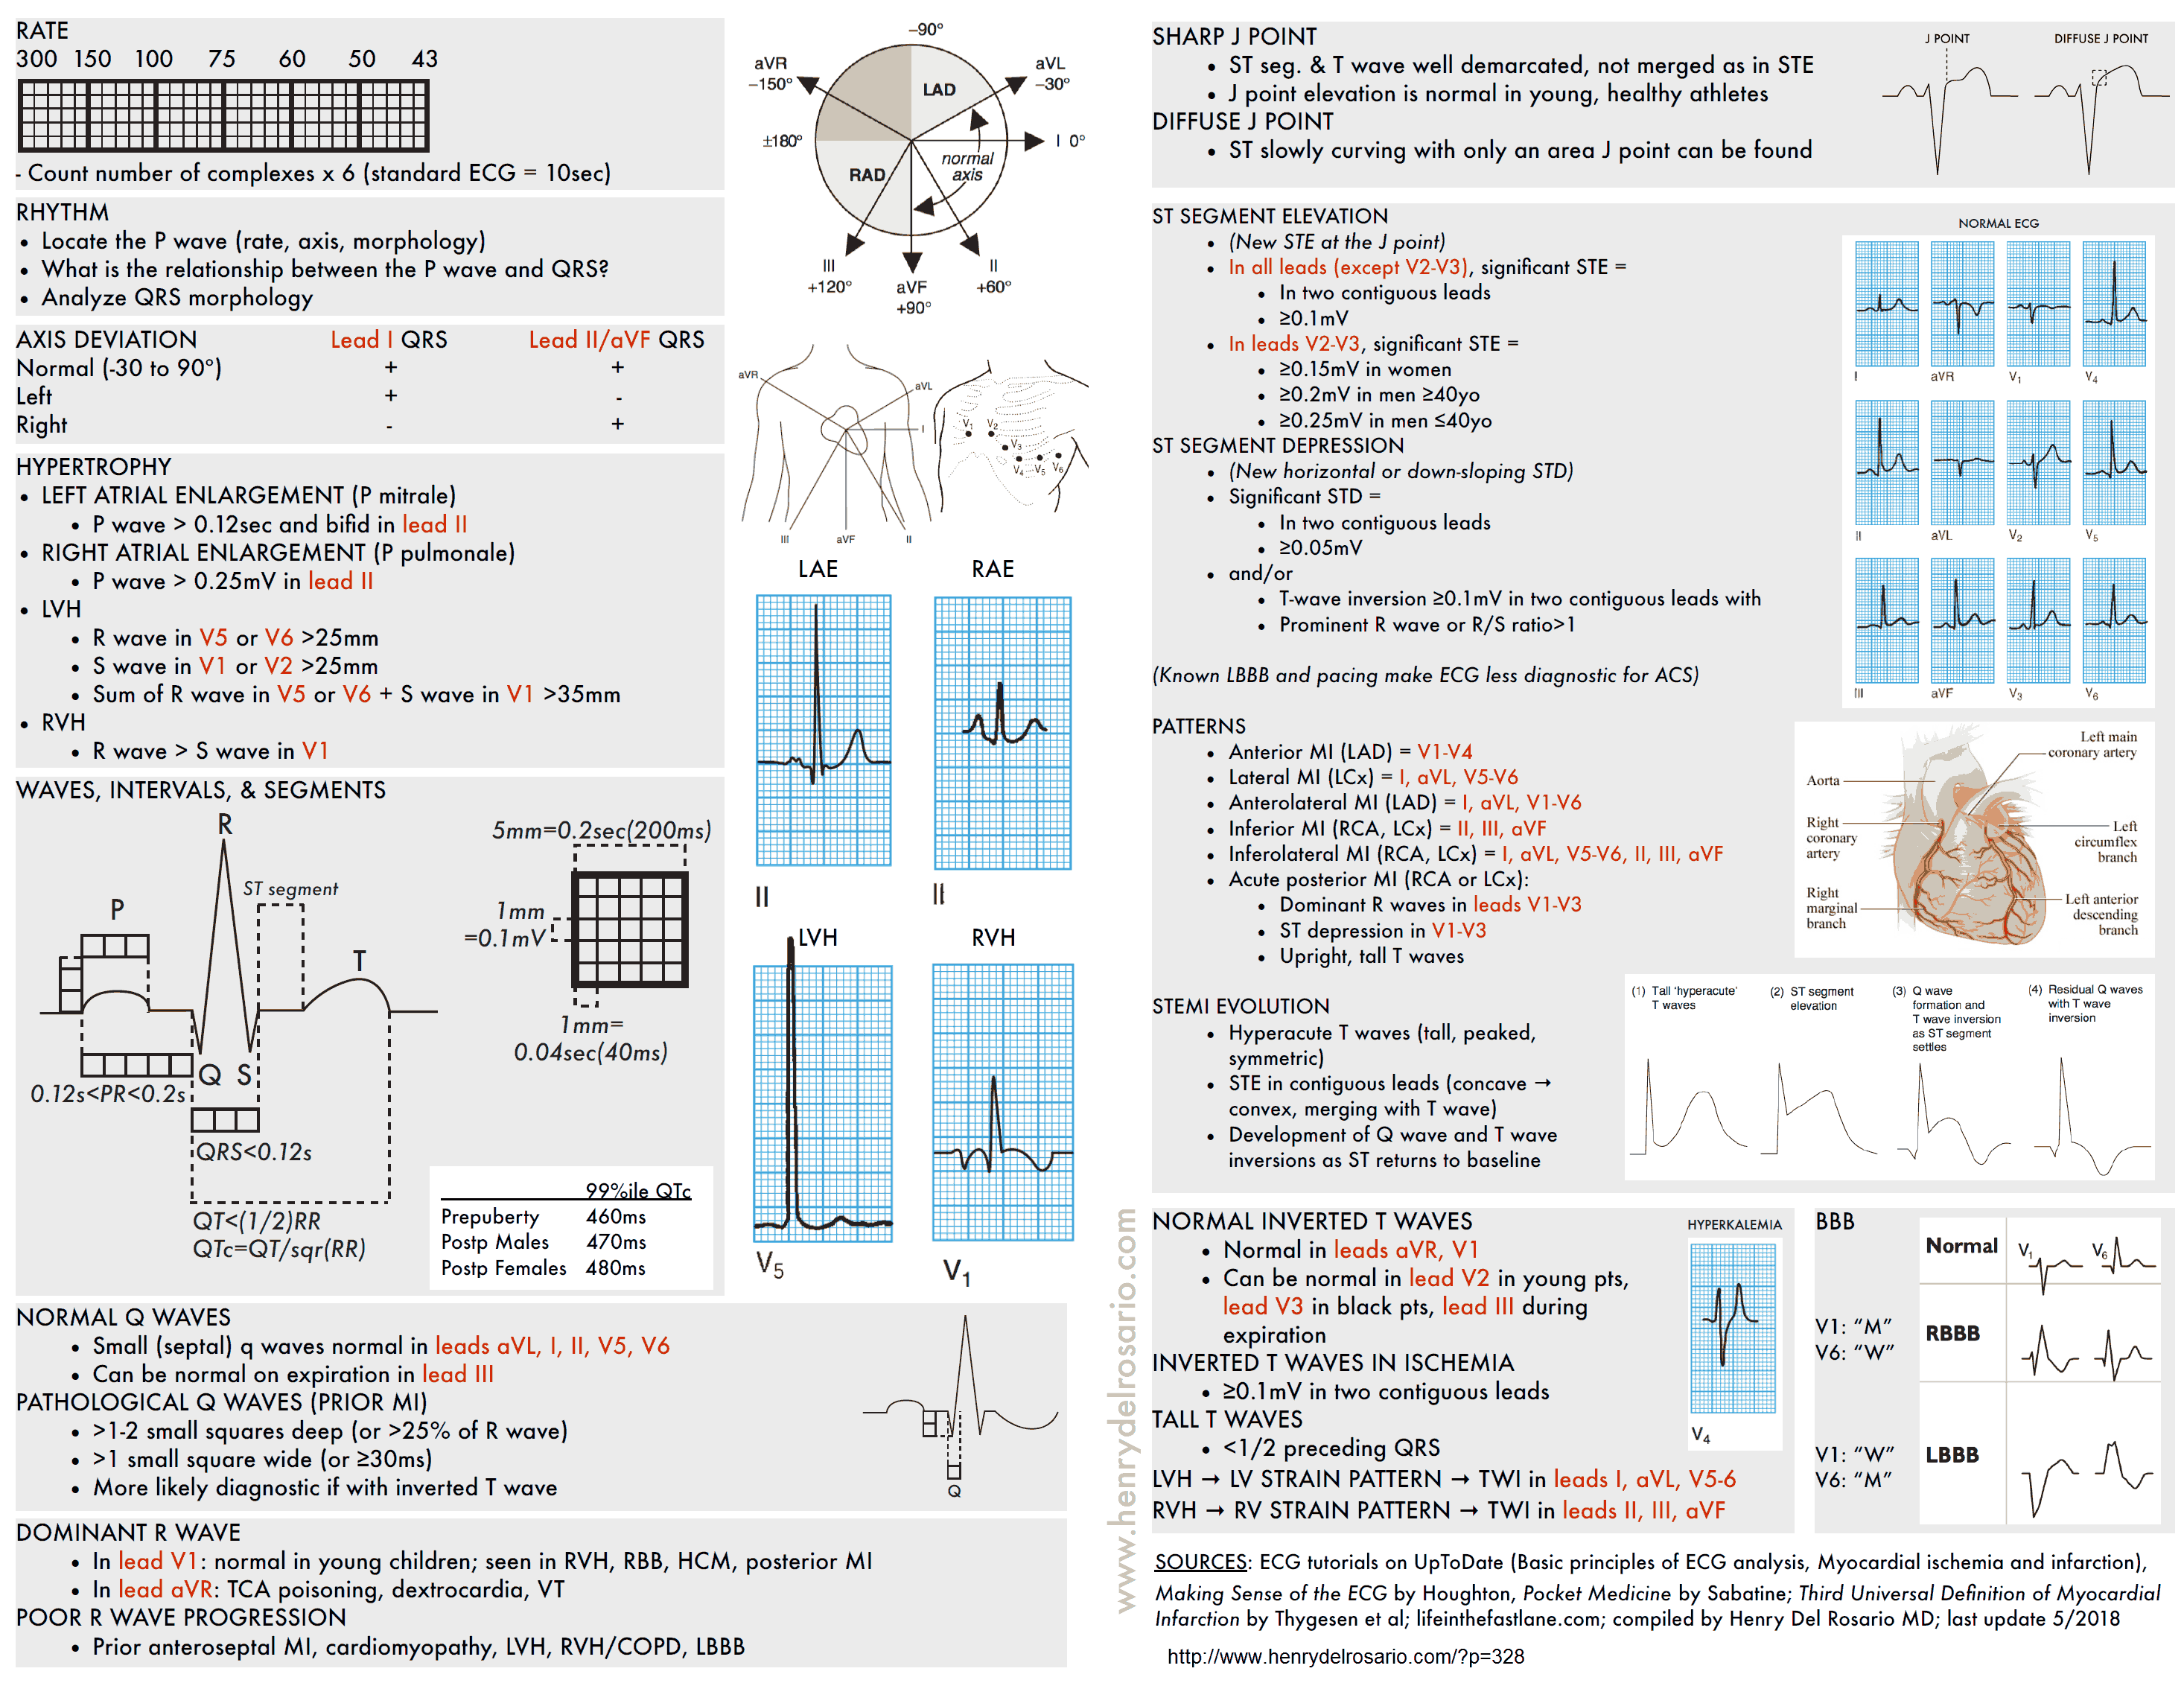
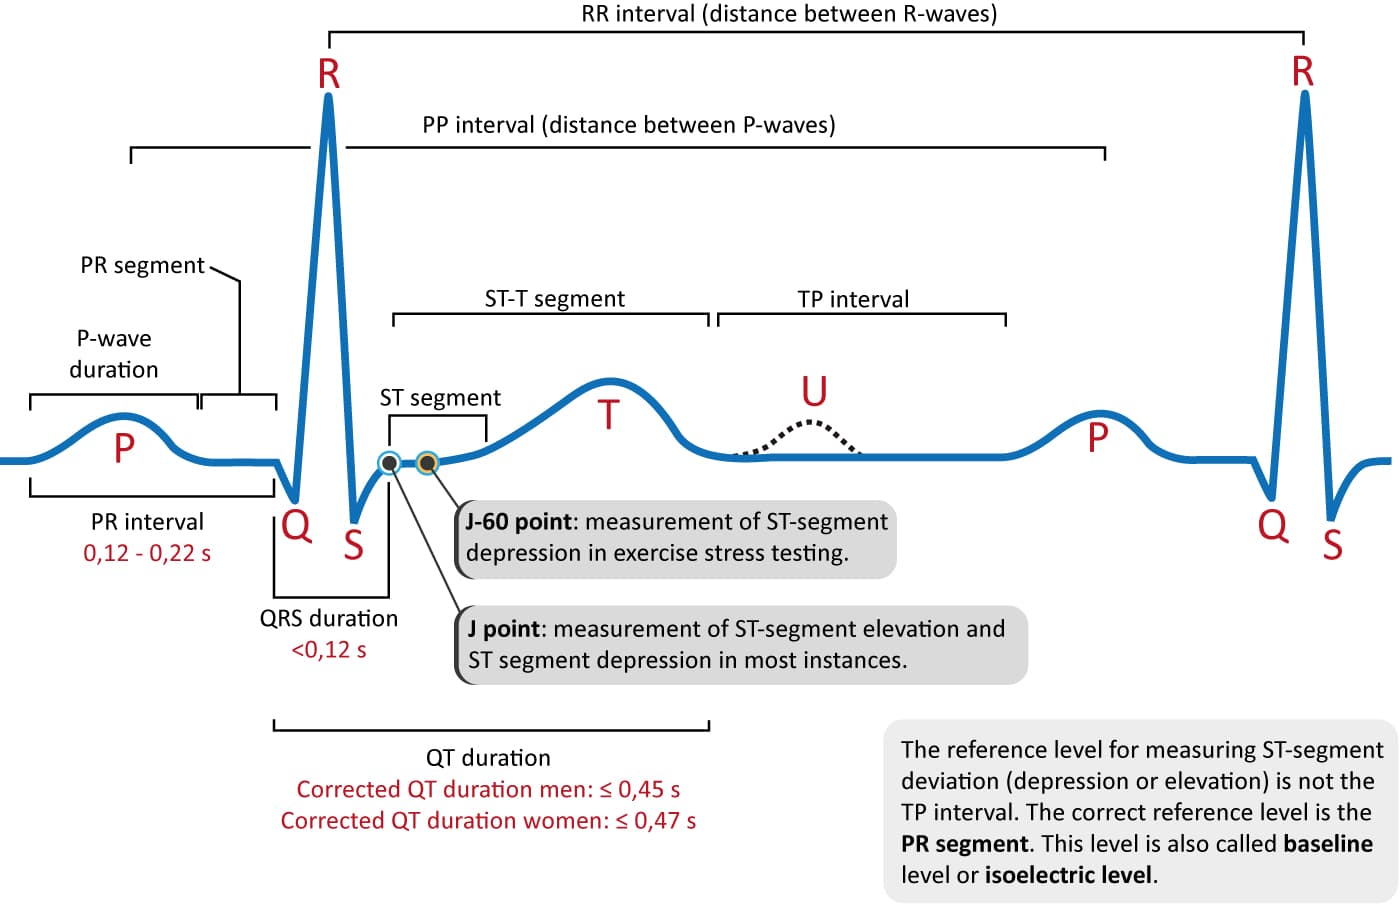
The heart’s electrical system begins at the sinoatrial (SA) node, travels through the atria, passes through the atrioventricular (AV) node, and continues down the bundle of His into the ventricular system. Each part of this journey creates characteristic waves on the ECG:
- P wave: Atrial depolarization (contraction)
- PR interval: Time from atrial to ventricular activation
- QRS complex: Ventricular depolarization
- ST segment: Early ventricular repolarization
- T wave: Ventricular repolarization (relaxation)
- QT interval: Total ventricular electrical activity duration
The Professional 10-Step ECG Interpretation Method

Professional ECG interpretation requires a systematic approach that ensures no critical findings are missed. This methodical process, used by cardiologists worldwide, provides consistent and accurate results.
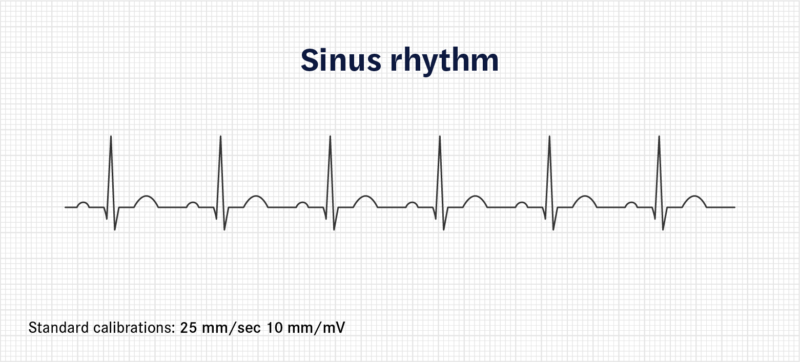
Step 1: Verify Technical Details
Before beginning interpretation, always confirm:
- Patient identification matches the ECG
- Date and time of recording
- ECG calibration (standard: 25mm/s paper speed, 10mm/1mV amplitude)
- Lead placement accuracy
- Artifact presence or absence
Step 2: Determine Heart Rate
For Regular Rhythms:
- Count the number of large squares between consecutive R waves
- Divide 300 by this number
- Example: 4 large squares = 300/4 = 75 beats per minute
For Irregular Rhythms:
- Count QRS complexes in a 10-second strip
- Multiply by 6 for beats per minute
- More accurate for variable heart rates
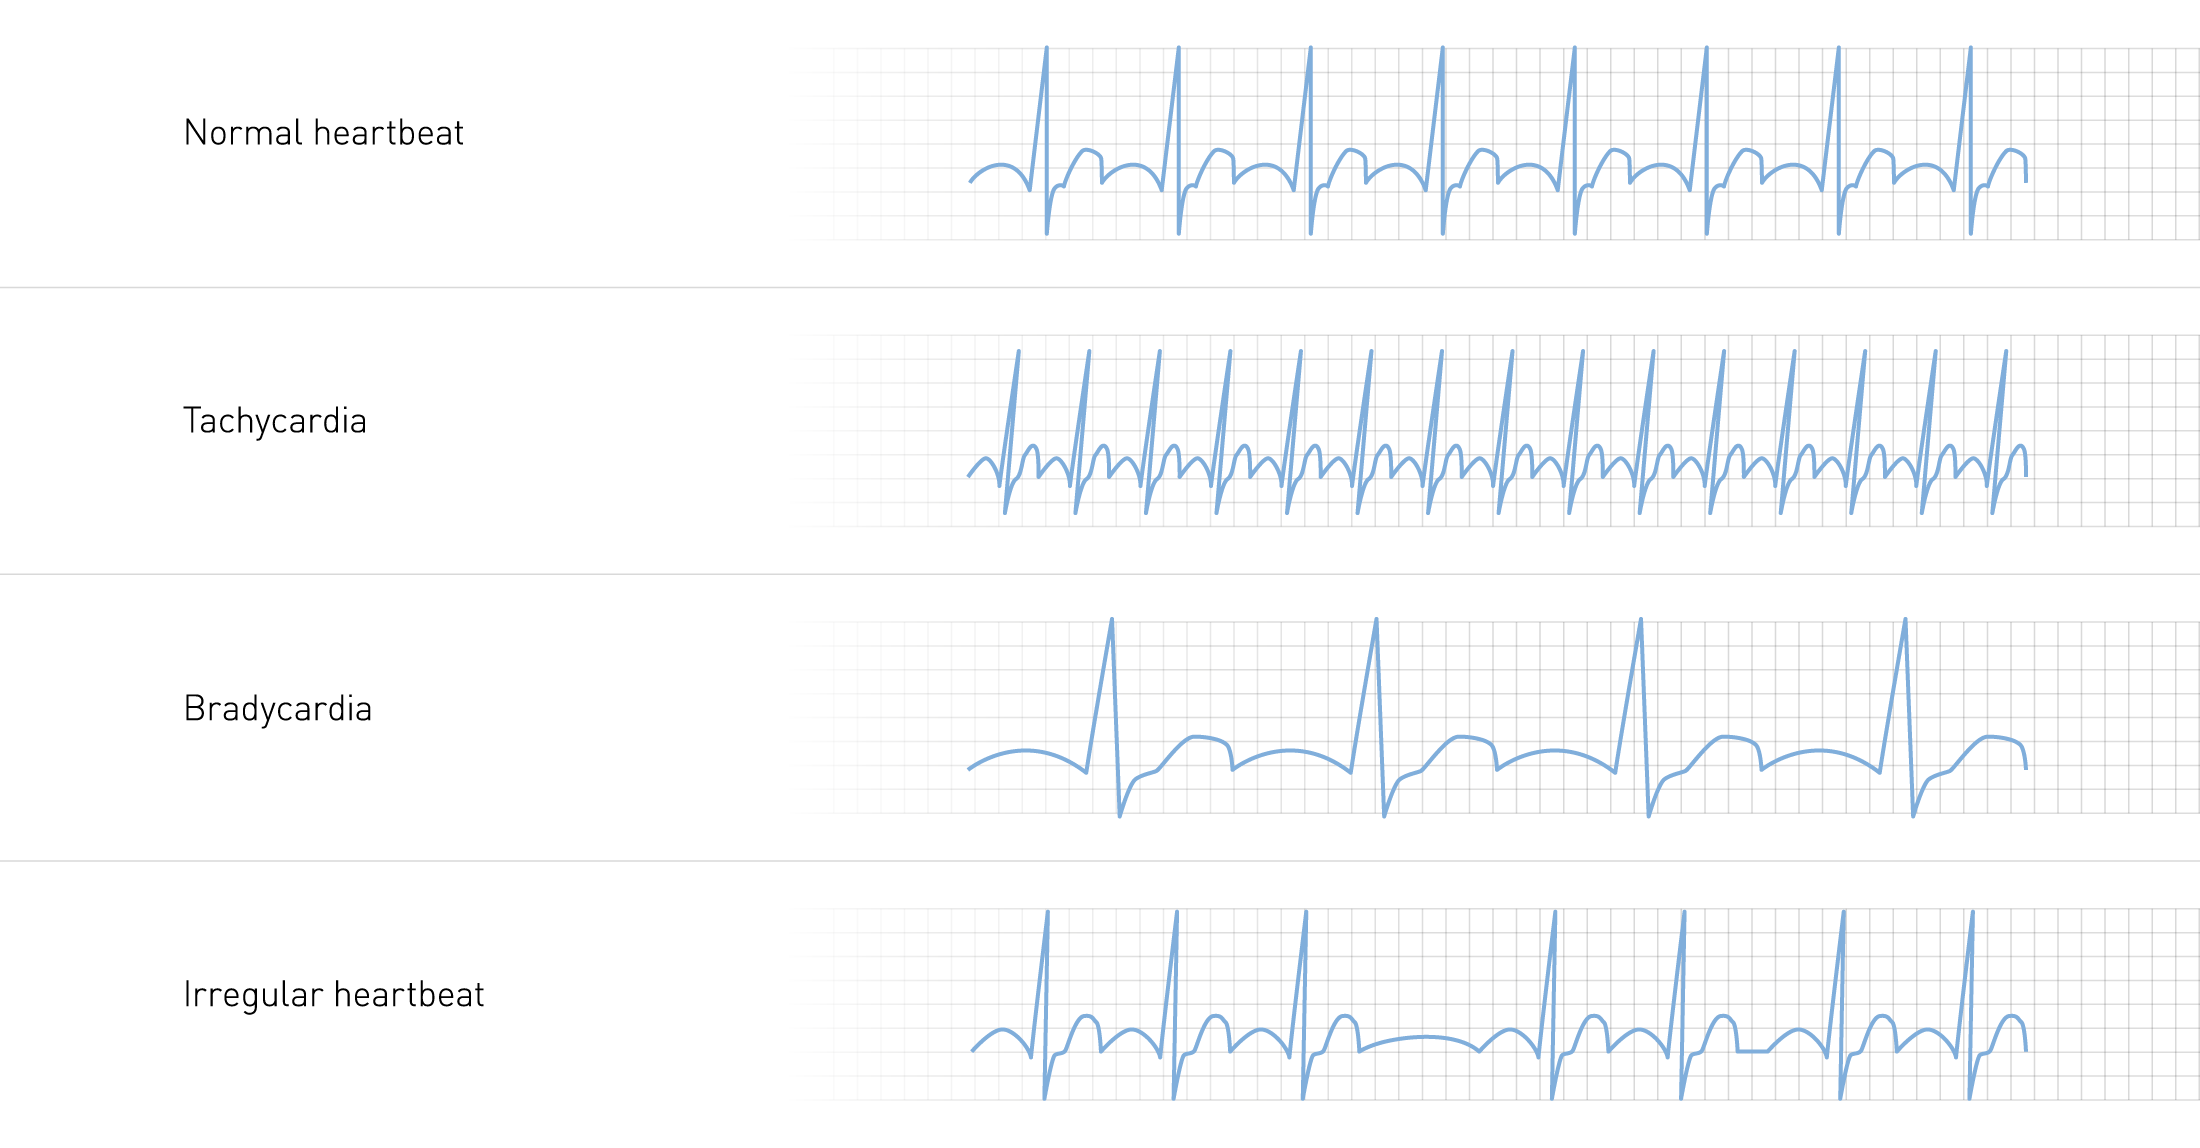
Normal Heart Rate Parameters:
- Normal: 60-100 beats per minute
- Bradycardia: Less than 60 beats per minute
- Tachycardia: Greater than 100 beats per minute
Step 3: Assess Heart Rhythm
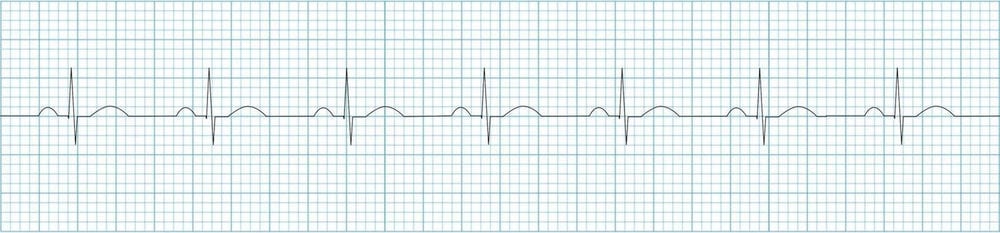
Rhythm assessment involves determining regularity and identifying the pacemaker origin:
Regular vs. Irregular:
- Use calipers or paper to mark R-R intervals
- Move along the strip to check consistency
- Note any patterns in irregularity
Rhythm Classification:
- Regular: Consistent R-R intervals
- Regularly irregular: Predictable pattern of irregularity
- Irregularly irregular: Completely chaotic timing (often atrial fibrillation)
Step 4: Evaluate P Waves

P wave analysis reveals atrial activity and conduction patterns:
Key Questions:
- Are P waves present and visible?
- Is there one P wave before each QRS complex?
- Are P waves upright in leads I, II, and aVF?
- Are P waves inverted in aVR?
- What is the P wave morphology and duration?
Abnormal P Wave Findings:
- Absent P waves: May indicate atrial fibrillation or junctional rhythm
- Inverted P waves: Suggest ectopic atrial pacemaker
- Multiple P wave morphologies: Indicate multifocal atrial rhythm
- Sawtooth pattern: Characteristic of atrial flutter
Step 5: Measure PR Interval
The PR interval represents the time from atrial activation to ventricular activation, normally measuring 120-200 milliseconds (3-5 small squares).
Prolonged PR Interval (>200ms):
- First-degree AV block: Fixed prolonged PR interval
- Second-degree AV block: Progressive prolongation or intermittent conduction
- Third-degree AV block: Complete dissociation between atria and ventricles
Shortened PR Interval (<120ms):
- Wolff-Parkinson-White syndrome: Accessory pathway conduction
- Junctional rhythm: Impulse originates near AV node
Step 6: Analyze QRS Complex

QRS analysis provides information about ventricular conduction and morphology:
Width Assessment:
- Narrow QRS (<120ms): Normal conduction through His-Purkinje system
- Wide QRS (>120ms): Bundle branch block, ventricular origin, or aberrant conduction
Bundle Branch Block Recognition: Using the “WiLLiaM MaRRoW” mnemonic:
- LBBB (WiLLiaM): W pattern in V1, M pattern in V6
- RBBB (MaRRoW): M pattern in V1, W pattern in V6
Height Assessment:
- Low voltage: QRS height <5mm in limb leads or <10mm in chest leads
- High voltage: May indicate ventricular hypertrophy
Step 7: Examine ST Segments

ST segment analysis is crucial for identifying acute coronary syndromes:
Normal ST Segment:
- Isoelectric (at baseline level)
- Smooth transition from QRS to T wave
ST Elevation:
- Significant: >1mm in limb leads or >2mm in chest leads
- STEMI criteria: Elevation in two contiguous leads
- Other causes: Pericarditis, early repolarization, left ventricular aneurysm
ST Depression:
- Significant: ≥0.5mm in two contiguous leads
- Suggests: Myocardial ischemia, digoxin effect, hypokalemia
- Pattern recognition: Horizontal, downsloping, or upsloping
Step 8: Interpret T Waves

T wave analysis provides insight into repolarization abnormalities:
Normal T Waves:
- Upright in leads I, II, V3-V6
- Inverted in aVR
- May be inverted in III and V1
Abnormal T Wave Patterns:
- Tall, peaked T waves: Hyperkalemia, hyperacute STEMI
- Inverted T waves: Ischemia, bundle branch block, pulmonary embolism
- Flattened T waves: Hypokalemia, ischemia, nonspecific changes
- Biphasic T waves: Ischemia, electrolyte imbalances
Step 9: Calculate QT Interval
The QT interval represents total ventricular electrical activity duration and must be corrected for heart rate (QTc):
Normal QTc Values:
- Men: <440 milliseconds
- Women: <460 milliseconds
- Prolonged QTc: Associated with increased risk of torsades de pointes
QTc Calculation Methods:
- Bazett’s formula: QTc = QT/√RR interval
- Fridericia’s formula: More accurate at extreme heart rates
Step 10: Determine Cardiac Axis

Cardiac axis indicates the overall direction of ventricular depolarization:
Quick Axis Determination:
- Normal axis (-30° to +90°): Positive QRS in I and II
- Left axis deviation (-30° to -90°): Positive I, negative II
- Right axis deviation (+90° to +180°): Negative I, positive II
- Extreme axis deviation: Negative in both I and II
Common ECG Abnormalities and Arrhythmias
Atrial Arrhythmias
Atrial Fibrillation:
- Irregularly irregular rhythm
- Absent P waves with fibrillatory baseline
- Variable ventricular response
- High stroke risk requiring anticoagulation
Atrial Flutter:
- Regular atrial rate of 250-400 beats per minute
- Characteristic “sawtooth” P waves
- Variable AV conduction ratios (2:1, 3:1, 4:1)
- Often requires cardioversion or rate control
Ventricular Arrhythmias

Ventricular Tachycardia:
- Wide QRS complexes (>120ms)
- Rate 150-250 beats per minute
- May be sustained or non-sustained
- Requires immediate evaluation and treatment
Ventricular Fibrillation:
- Chaotic, irregular waveform
- No identifiable QRS complexes
- Medical emergency requiring immediate defibrillation
- Often fatal without prompt intervention
Premature Ventricular Contractions (PVCs):
- Early, wide QRS complexes
- Compensatory pause following
- May be unifocal or multifocal
- Significance depends on frequency and pattern
Conduction Blocks
First-Degree AV Block:
- PR interval >200 milliseconds
- All P waves conducted
- Usually benign, requires monitoring
Second-Degree AV Block:
- Type I (Wenckebach): Progressive PR prolongation until dropped QRS
- Type II: Fixed PR interval with intermittent dropped QRS complexes
- Type II more concerning, may require pacemaker
Third-Degree (Complete) AV Block:
- Complete dissociation between atria and ventricles
- Independent P waves and QRS complexes
- Usually requires permanent pacemaker
ADVANCED ECG INTERPRETATION TECHNIQUES TO READ AN ECG OUTPUT LIKE A PRO
Acute Coronary Syndrome Recognition
STEMI (ST-Elevation Myocardial Infarction):
- ST elevation in territorial distribution
- Reciprocal changes in opposite leads
- Q wave development indicates established infarction
- Time-sensitive condition requiring immediate catheterization
NSTEMI/Unstable Angina:
- ST depression or T wave inversions
- No ST elevation meeting STEMI criteria
- Troponin elevation distinguishes NSTEMI from unstable angina
- Risk stratification guides management timing
Chamber Enlargement and Hypertrophy
Left Ventricular Hypertrophy (LVH):
- Sokolow-Lyon criteria: S(V1) + R(V5 or V6) >35mm
- Cornell criteria: Different thresholds for men and women
- Associated ST-T wave changes in lateral leads
- Indicates increased cardiovascular risk
Right Ventricular Hypertrophy (RVH):
- Dominant R wave in V1
- Right axis deviation
- T wave inversions in right precordial leads
- Often associated with pulmonary disease
Clinical Correlation and Decision Making
Integrating ECG Findings with Clinical Presentation
Professional ECG interpretation extends beyond pattern recognition to clinical correlation:
Chest Pain Evaluation:
- ECG changes guide triage decisions
- Serial ECGs may reveal evolving patterns
- Comparison with previous ECGs essential
- Integration with cardiac biomarkers crucial
Syncope Workup:
- Arrhythmia detection guides treatment
- Conduction system evaluation
- Risk stratification for sudden cardiac death
- May require extended monitoring
Pre-operative Assessment:
- Cardiac risk stratification
- Identification of occult coronary disease
- Baseline documentation for comparison
- Anesthetic management implications
Documentation and Communication
Professional ECG interpretation requires clear, concise reporting:
Essential Elements:
- Rate, rhythm, and axis
- Interval measurements
- Morphology descriptions
- Clinical significance
- Comparison with previous ECGs
- Recommendations for follow-up
Communication with Colleagues:
- Urgent findings require immediate notification
- Clear description of abnormalities
- Clinical context provision
- Follow-up recommendations
Technology and Modern ECG Interpretation
Computer-Assisted Interpretation
Modern ECG machines provide automated interpretation, but professional oversight remains essential:
Advantages:
- Rapid initial screening
- Measurement standardization
- Pattern recognition assistance
- Educational value for beginners
Limitations:
- Artifact misinterpretation
- Context-insensitive analysis
- False positive findings
- Inability to correlate clinically
Advanced ECG Technologies
High-Resolution ECG:
- Signal-averaged techniques
- Late potential detection
- Improved noise reduction
- Research and specialized applications
Digital ECG Systems:
- Electronic storage and retrieval
- Network connectivity
- Telemedicine applications
- Quality improvement tracking
Developing Professional Expertise
Continuous Learning Strategies
Pattern Recognition Development:
- Regular exposure to diverse ECGs
- Case-based learning approaches
- Systematic review of missed diagnoses
- Peer consultation and discussion
Skill Maintenance:
- Regular competency assessment
- Continuing education participation
- Literature review and updates
- Professional organization involvement
Common Pitfalls and How to Avoid Them
Technical Issues:
- Poor electrode placement
- Artifact interference
- Calibration errors
- Lead reversal
Interpretation Errors:
- Overreliance on computer interpretation
- Missing subtle changes
- Failure to correlate clinically
- Inadequate comparison with previous ECGs
Quality Assurance and Standardization
Professional Standards
Certification Programs:
- Professional society guidelines
- Competency-based assessments
- Continuing education requirements
- Quality metrics tracking
Institutional Protocols:
- Standardized interpretation criteria
- Peer review processes
- Critical value notification
- Documentation requirements
Future Directions in ECG Interpretation
Artificial Intelligence Integration
Machine Learning Applications:
- Pattern recognition enhancement
- Diagnostic accuracy improvement
- Risk prediction models
- Workflow optimization
Challenges and Opportunities:
- Algorithm validation requirements
- Clinical integration complexity
- Regulatory considerations
- Professional training adaptation
Conclusion: Mastering Professional ECG Interpretation

Reading ECGs like a professional requires mastering the systematic 10-step approach, understanding normal and abnormal patterns, and developing the clinical judgment to correlate findings with patient presentation. This skill develops through dedicated practice, continuous learning, and regular exposure to diverse ECG patterns.
The journey from novice to expert ECG interpreter involves understanding the fundamental principles of cardiac electrophysiology, mastering systematic interpretation techniques, recognizing pathological patterns, and developing clinical correlation skills. Professional competency requires ongoing education, quality assurance participation, and adaptation to evolving technologies.
Remember that ECG interpretation is both an art and a science. While systematic approaches provide the foundation, clinical experience and judgment guide the application of these principles to individual patient care. The integration of ECG findings with clinical presentation, laboratory results, and imaging studies represents the pinnacle of professional cardiovascular assessment.
As healthcare continues to evolve with technological advances, the fundamental skills of ECG interpretation remain essential for all healthcare providers involved in cardiovascular care. Whether you’re beginning your journey or refining your expertise, the systematic approach outlined in this guide will serve as your foundation for professional ECG interpretation mastery.